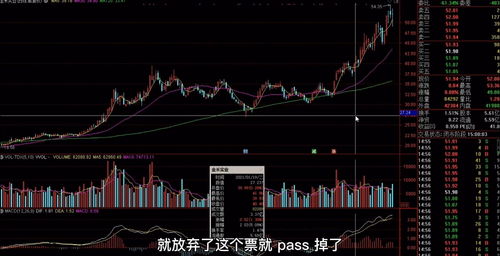
Getting Started with Stock Indicators Coding
Stock indicators are essential tools for analyzing and predicting market trends. If you're interested in coding stock indicators, here's a beginner's guide to get you started.
Before diving into coding indicators, choose a programming language suitable for financial analysis. Popular choices include Python, R, and MATLAB due to their robust libraries for financial data analysis.
1.
2.
3.
4.
Let's look at some basic code snippets in Python using the `pandas` and `numpy` libraries:
```python
import pandas as pd
import numpy as np
def calculate_sma(data, window=20):
return data['Close'].rolling(window=window).mean()
def calculate_ema(data, span=20):
return data['Close'].ewm(span=span, adjust=False).mean()
Example usage
stock_data = pd.read_csv('stock_data.csv')
stock_data['SMA'] = calculate_sma(stock_data)
stock_data['EMA'] = calculate_ema(stock_data)
```
```python
def calculate_rsi(data, window=14):
delta = data['Close'].diff()
gain = (delta.where(delta > 0, 0)).rolling(window=window).mean()
loss = (delta.where(delta < 0, 0)).rolling(window=window).mean()
rs = gain / loss
return 100 (100 / (1 rs))
Example usage
stock_data['RSI'] = calculate_rsi(stock_data)
```
```python
def calculate_macd(data, short_window=12, long_window=26):
short_ema = data['Close'].ewm(span=short_window, adjust=False).mean()
long_ema = data['Close'].ewm(span=long_window, adjust=False).mean()
macd_line = short_ema long_ema
signal_line = macd_line.ewm(span=9, adjust=False).mean()
return macd_line, signal_line

Example usage
macd, signal = calculate_macd(stock_data)
stock_data['MACD'] = macd
stock_data['Signal'] = signal
```
After calculating indicators, visualize them using libraries like `matplotlib` or `plotly` for better interpretation.
Coding stock indicators involves understanding the indicators, choosing a suitable programming language, writing code to calculate indicators, and visualizing the results. Continuous learning and practice will enhance your coding skills in financial analysis.